Conservation, Homepage Slider, Water Quality
Phosphorus progress in Ohio
By Matt Reese and Dusty Sonnenberg, CCA, Ohio Field Leader: a project of the Ohio Soybean Council and soybean checkoff.
Heilmann Farms has been operating for nearly a century in Lucas County, just off the shores of Lake Erie. In that time, plenty has changed on the farm. In the last couple of decades, on-farm changes have included a significant reduction in phosphorus applications on the farm.
Phosphorus, of course, has been the source of extensive scrutiny in terms of water quality around the state, particularly in Lake Erie. In the case of Heilmann Farms, reducing phosphorus levels in their fields makes agronomic, economic and environmental sense.

“We have been deficit applying fertilizer for 20 years drawing down high fertility levels in fields. We intensely soil sample, and have developed yield management zones. We soil sample the heavier clay soils every three years, and soil sample the sand farms every other year,” said Jake Heilmann. “We’ve been using strip-till since 2008. We started strip-tilling 50% of the corn ground. Now we only strip-till corn on the heavy clay ground, which is about 10% of the corn acres. We variable rate phosphorus with the planter in the starter on all acres and do pre-plant anhydrous on the sand ground that does not fit as well with strip-till. So we strip-till the clay ground and then sidedress that corn later.”
Heilmann farms with his brother-in-law Matt Ditzig and two employees. Heilmann’s father is retired, but still helps during the season. The farm’s productive soils are typically 70% corn, 25% soybeans and 5% wheat. Cover crops have also been an increasing mix in the rotation to help improve soils and keep nutrients in fields and out of the water. The water leaving some fields is controlled with drainage water management structures on the farm, and Heilmann plans adding additional structures with H2Ohio funds.
The nutrient management changes that have taken place on the farm in recent years are extraordinary in terms of impacts on water quality but not too far out of the norm for farms in the area, if for no other reason than economics.
“Many guys have been progressive in the area and implemented variable rate fertilizer application already, as well as the use of cover crops,” Heilmann said. “More guys are putting in drainage water control structures each year too.”

Andrew Gladden, IT manager for Luckey Farmers Inc. cooperative in Wood, Ottawa, Sandusky, Fulton, and Lucas counties and has seen a noticeable reduction in phosphorus sales in recent years. This is due to several factors, including the weather, but driving forces behind the reduction include voluntary efforts to adhere to the 4Rs from Luckey Farmers and the farms they work with, including an increase in variable rate fertilizer applications.
“We do have the data and we are showing the reductions. The most important thing we are seeing is the use of variable rate technology. That is a huge reduction in fertilizer. Being a 4R certified facility we actually have worked for 10 years on precision agriculture,” Gladden said. “The more we see people getting into variable rate, the less fertilizer they use. We see reduced fertilizer use in our sales numbers so we are trying to offer other services by building data management teams to help them manage their fields better.”
In some cases, farms are saving around 10% on their fertilizer bill while seeing yields increase 10% through the use of variable rate technology.
“One of the good things that has come out of the 4Rs is that the farming practices are changing. This gets farmers to really understand their farms and fields and where fertilizer needs to be placed. This has all been voluntary. Nothing has been mandated or regulated, but the growers we are working with are reducing their fertilizer input on their fields,” Gladden said. “It is great to work with these collaborating growers on this and help them understand how to reduce P application by putting it on where it needs to be and keeping plants healthy so they can uptake the nutrients effectively.”
Research results are showing the trend on a broader, statewide scale as well. A recent study conducted by Libby Dayton

and a research team from Ohio State University looked at soil test phosphorus (STP) trends from 1993 to 2015. This study was based on soil test results from a number of different soil labs, categorized by zip code. Maintaining STP within the maintenance range for crop production (20 to 40 parts per million based on a Mehlich-3 extraction) both maximizes crop yield potential while minimizing dissolved and particulate-bound phosphorus runoff concentrations.
A majority of Ohio counties (53) have decreasing STP levels. Another 13 counties have increasing STP levels, however within those 13, only two of the counties have the average STP level above the maintenance range of 20 to 40 parts per million. The other 11 counties were below 40 parts per million.
“Decreasing long-term STP trends and P balance is good news for Ohio farmers and all Ohioans interested in improving Ohio surface water quality,” Dayton said. “These results suggest that Ohio farmers are taking steps to manage P inputs and STP. Continued success will result in reduced P runoff and move Ohio closer to achieving water quality targets.”
Most of Ohio is showing decreasing soil test phosphorus trends. Here is the Mehlich-3 soil test phosphorus (STP) information by county in Ohio. Values in each county represent the 2015 median STP level. Color of county denotes STP trend significance from 1993 to 2015. Provided by OSU Extension.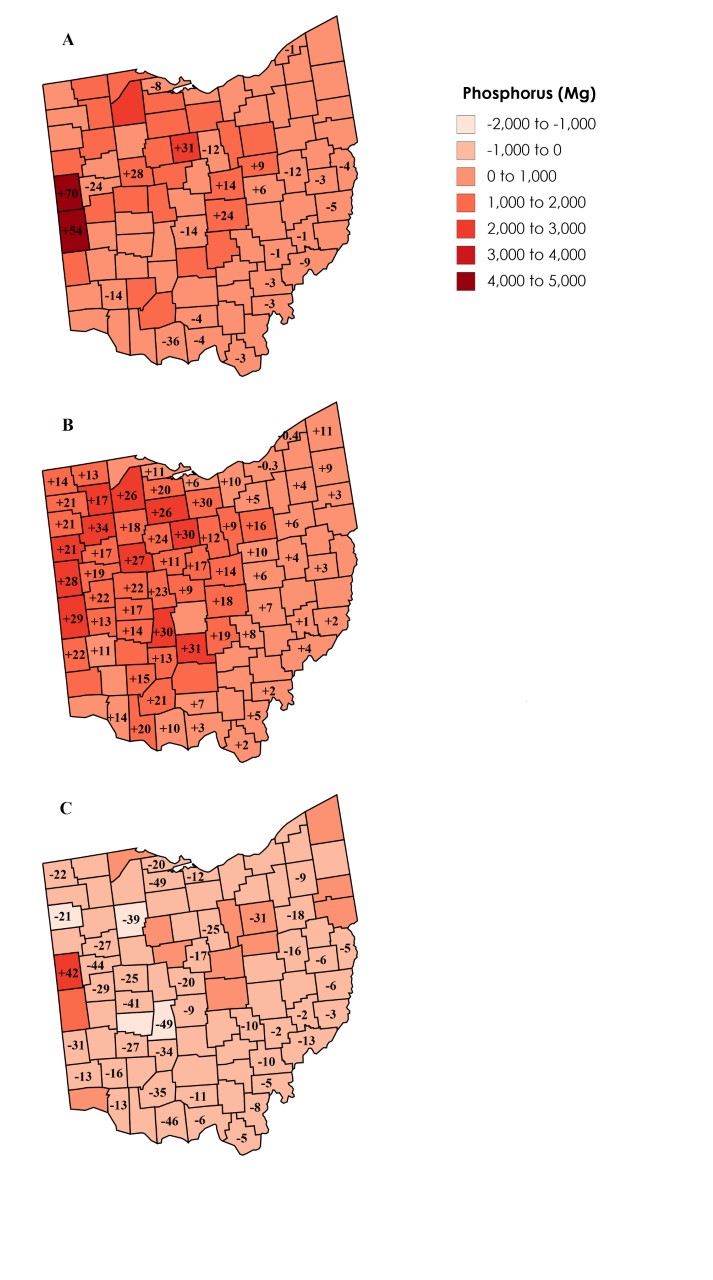
Range in phosphorus (P) inputs from commercial fertilizer and manure (A), P outputs from crop removal (B), and P balance (C), by Ohio county in 2014 denoted by color. Numbers within a county indicate significant trend (increase or decrease in Mg P yr-1) between 1987 and 2014. Data from Nutrient Use Geographic Information System (IPNI, 2014). Provided by OSU Extension.
Here are some highlights from the STP research:
- 96% of Ohio counties have median STP values (2015) in the build-up (<20 ppm Mechlich-3 P) or maintenance range (20 to 40 ppm Mechlich-3 P) for corn-soybean-wheat rotations.
- 63% of Ohio counties have significantly decreasing median STP trends.
- 18% of Ohio counties median STP trends show no significant change, while only 11% have significantly increasing STP trends.
OSU researchers also examined P inputs from commercial fertilizer and manure and P outputs from removal in harvested grain to calculate P balance: P balance = inputs – outputs. Phosphorus balance research highlights include:
- 22% of Ohio counties have decreasing trends of P inputs, while, for 9% of counties input trends are increasing.
- Decreasing trends in P inputs can be explained by changes in P application strategies.
- During the early 1970s, many farmers applied P fertilizer to build-up STP; however, since the 1980s, the goal of P fertilization changed to replace P removed by harvested crops. This indicates that farmers are managing their P fertilizer inputs.
- 76% of Ohio counties have increasing trends in P output.
- The increased P outputs in the research are attributed to increased P removal in harvested grain as grain yields have increased.
- 84% of counties (2014) have a negative P balance, demonstrating that P outputs exceed P inputs.
- 16% of counties have a positive P balance, but only two drain into the Western Lake Erie Basin.
A&L Great Lakes Laboratories Inc., Brookside Laboratories, and Spectrum Analytic Inc. provided Ohio soil test P data and the International Plant Nutrition Institute (IPNI) supplied the use of their Nutrient Use Geographic Information System database for the research.